Table – Ripple Effect of Departations Only Table – Ripple effect of deportations, without Trump tariffs, 2025-2026
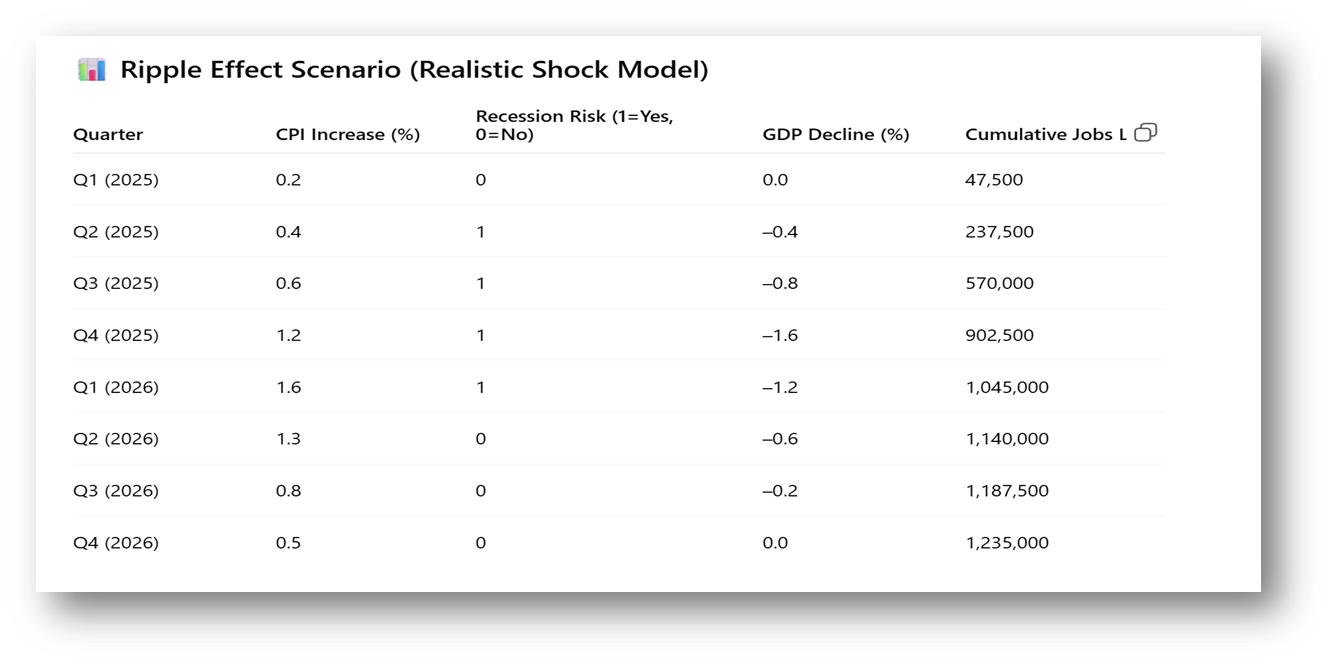 Table – Ripple effect of deportations, without Trump tariffs, 2025-2026
Six quarters of negative growth (from the deportation of one million worker immigrants). Impact similar if this takes two years, just slower.
Highlights:
- Peak GDP contraction: –1.6% in Q4 2025.
- Job losses more than double previous estimates, exceeding 1.2 million.
- Inflation spikes to 1.6% per quarter, driven by labor shortages and collapsing local supply chains.
- Recession risk is sustained over 4 quarters due to cascading demand destruction and regional economic breakdowns.
Now let’s add in the calculations for a 10% tariff for most countries
Which we all know American citizens pay through importer’s tax on arrival in the USA.
Here is the final table showing the 8-quarter economic impact when combining both mass deportations and the imposition of proposed tariffs (10% globally, higher for China):
📊 Table – Economic Forecast: Combined Effects of Deportation + Tariffs, Recession, CPI and Job Loss
Quarter | CPI Increase (%) | Recession Risk (1=Yes, 0=No) | GDP Decline (%) | Cumulative Jobs Lost |
Q1 (2025) | 0.5 | 1 | –0.2 | 75,000 |
Q2 (2025) | 0.7 | 1 | –0.7 | 325,000 |
Q3 (2025) | 1.1 | 1 | –1.1 | 725,000 |
Q4 (2025) | 1.8 | 1 | –1.9 | 1,125,000 |
Q1 (2026) | 2.1 | 1 | –1.4 | 1,290,000 |
Q2 (2026) | 1.7 | 1 | –0.9 | 1,380,000 |
Q3 (2026) | 1.1 | 0 | –0.4 | 1,440,000 |
Q4 (2026) | 0.8 | 0 | –0.1 | 1,500,000 |
Eight quarters of consecutive shrinking economy. Just based on these two policies.
So, the CPI impact is 4.1% in year one, and 5.7% in 2026. Or 9.8% added inflation over two years, self-inflicted by Trump’s radical moves, which are not recommended by any credible economist that does not work for him. Remember these are the isolated impacts of just these two things, beyond normal inflation, which is now at a 2.4% annualized rate.
Hence, the Chairman of The Federal Reserve, Jerome Powell, rightly has not reduced the key interest rate due to massive uncertainty and presidential moves that will drive inflation up 9.8% in 2025-2026. Of course, when job loss climbs radically, he will have to shift priorities and let inflation run to create more hiring again.
What does this mean for business?
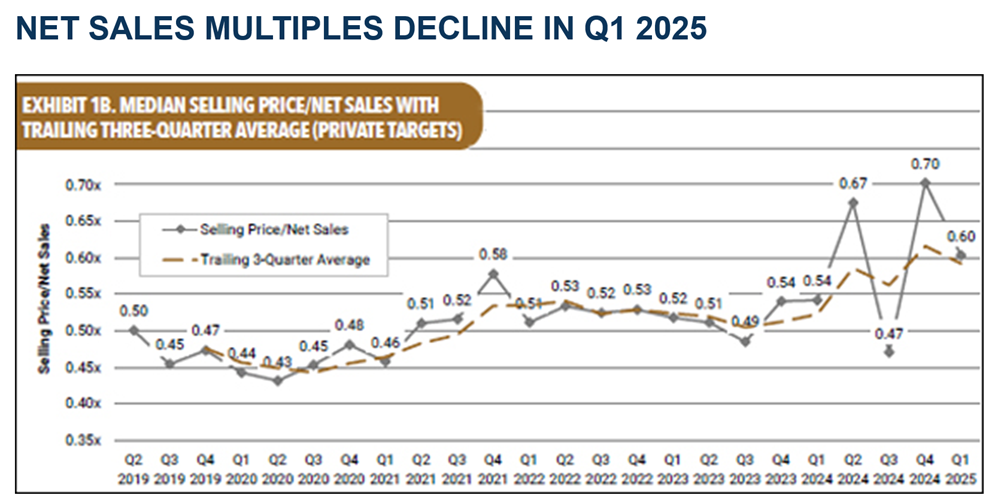
Business valuations will go down significantly; this has already started, as shown below. A massive impact on people wishing to exit for retirement or to cash out and start another business. It will create buying opportunities for those with lots of cash (rich people) and bankrupt small businesses that cannot withstand the impact. Just like the BB bill, it advantages billionaires and screws the average American.
Now let’s add into the calculations a 10% tariff for most countries
Which we all know American citizens pay through importer’s tax on arrival in the USA.
Here is the final table showing the 8-quarter economic impact when combining both mass deportations and the imposition of proposed tariffs (10% globally, higher for China):
📊 Table – Economic Forecast: Combined Effects of Deportation + Tariffs – CPI, GDP and Job Loss
Quarter | CPI Increase (%) | Recession Risk (1=Yes, 0=No) | GDP Decline (%) | Cumulative Jobs Lost |
Q1 (2025) | 0.5 | 1 | –0.2 | 75,000 |
Q2 (2025) | 0.7 | 1 | –0.7 | 325,000 |
Q3 (2025) | 1.1 | 1 | –1.1 | 725,000 |
Q4 (2025) | 1.8 | 1 | –1.9 | 1,125,000 |
Q1 (2026) | 2.1 | 1 | –1.4 | 1,290,000 |
Q2 (2026) | 1.7 | 1 | –0.9 | 1,380,000 |
Q3 (2026) | 1.1 | 0 | –0.4 | 1,440,000 |
Q4 (2026) | 0.8 | 0 | –0.1 | 1,500,000 |
Eight quarters of consecutive shrinking economy. Just based on these two policies.
So, the CPI impact is 4.1% in year one, and 5.7% in 2026. Or 9.8% added inflation over two years, self-inflicted by Trump’s radical moves which are not recommended by any credible economist that does not work for him. Remember these are the isolated impacts of just these two things, beyond normal inflation, which is now at a 2.4% annualized rate.
Hence, the chairman of The Federal Reserve, Jerome Powell, rightly has not reduced the key interest rate due to massive uncertainty and presidential moves that will drive inflation up 9.8% in 2025-2026. Of course, when job loss climbs radically, he will have to shift priorities and let inflation run to create more hiring again.
What does this mean for business?
Business valuations will go down significantly; this has already started, as shown below. A massive impact on people wishing to exit for retirement or to cash out and start another business. It will create buying opportunities for those with lots of cash (rich people) and bankrupt small businesses that cannot withstand the impact. Just like the BB bill it advantages billionaires and screws the average American.
I do not understand how any smart person, excepting billionaires, supports Donald Trump.

It makes no sense to me!
And there is a lot more, like 30,000 documented lies in his first term (see The NY Times list). Bragging about grabbing women’s private parts. Obvious low IQ and mental degradation. He cannot string three coherent sentences together without going off on a tangent to campaign, name-call, blame someone, brag, or lie. Trump literally has the maturity level of a ten-year-old schoolyard bully. Diagnosed as a malignant narcissist by dozens of psychologists. Lacking all vision, abstract thinking capabilities, and ethics.
I could go on, but most of these twenty-five things individually are enough to reject him for ANY public office. Think. The only real question is, how do we get Trump out of office ASAP? Like we did Nixon, I guess.
A few other crazy things Trump said, just to refresh your memory because there are so many:
- Arresting people without due process (everyone, even illegal visitors and tourists, gets full constitutional rights in the USA). Then deporting them to prisons known to be brutal to inmates.
- Said Biden was replaced by a robot sometime during his term
- “They’re eating the pets.”
- There is an immigrant crime wave, with millions of murderers released from other countries’s jails. Actually, the crime rate of immigrants is about 50% that of American citizens.
– Territorial Fantasies & Expansionist RhetoricProposing to annex Canada as the 51st U.S. state
Trump repeatedly mused about making Canada a U.S. state, calling Prime Minister Trudeau “Governor” and suggesting economic and political union via tariffs and economic coercion. news.yahoo.com+9apnews.com+9en.wikipedia.org+9en.wikipedia.org+1en.wikipedia.org+1.
Threatening to annex Canada by economic force
He stated he’d use tariffs to push Canada into annexation, not just joking around .
Reviving Monroe Doctrine-style expansion
His foreign-policy agenda included reclaiming territory—Greenland, Panama Canal, Canada—as imperial pursuits apnews.com+12en.wikipedia.org+12en.wikipedia.org+12.
Musing about buying or using force to take Greenland
Trump claimed he might purchase Greenland, even threatening force to secure it vanityfair.com+4time.com+4news.com.au+4en.wikipedia.org.
Announcing Greenland resided under U.S. “homeland defense” control
He shifted Greenland under U.S. Northern Command, signaling intent to treat it like domestic territory youtube.com+15thetimes.co.uk+15threads.com+15.
Laying claim to the Panama Canal zone
In 2024–25 he vowed to “reclaim” the Panama Canal, reportedly considering military options vanityfair.comnews.yahoo.com+6en.wikipedia.org+6en.wikipedia.org+6.
🏝️ Other Unrealizable or Absurd Proposals
Turning Gaza into a tourist “Riviera”
He floated a plan to rebuild Gaza as a luxury resort—a geopolitical nonstarter apnews.com+1thesun.ie+1.
Reopening Alcatraz to “house migrants in limbo”
Suggesting migrant detention on Alcatraz, an uninhabited island, was clearly impractical apnews.com+1thetimes.co.uk+1.
Inspecting Fort Knox gold with Elon Musk
Oddly framing a security issue as a Musk-led inspection apnews.com.
Renaming the Gulf of Mexico to “Gulf of America”
He signed an executive order to rename the body of water unilaterally en.wikipedia.org+1time.com+1.
Proposing U.S. entry into the British Commonwealth
Suggested joining a defunct empire structure apnews.com.
Accepting a luxury private jet from Qatar as Air Force One
He said he might use a Qatari private jet as Air Force One apnews.com.
📜 Constitutional & Institutional Insanity
Claiming he might not need to uphold the Constitution
In a May 2025 NBC interview, he said he “doesn’t know” if he is bound to uphold it ft.com.
Suggesting a possible third presidential term
Floated idea of running again beyond term limits, despite constitutional clarity en.wikipedia.org+3ft.com+3apnews.com+3.
Refusing clarity on upholding due legal process
Said he was unsure “if people in the US deserve due process” ft.com.
📊 Mass Misinformation & Wild Claims
Asserting “100 million” psychiatric patients entering via migration
Promoted unsubstantiated claims about asylum seekers and mental illness en.wikipedia.org.
Exaggerated violent crime rates and “migrant crime wave”
He claimed tens of thousands of criminals entering illegally; fact-checks show no evidence en.wikipedia.org.
Claiming U.S. had the “most secure border” under his administration
Data on illegal crossings contradicts that assertion thesun.ie+3en.wikipedia.org+3en.wikipedia.org+3.
Repeating falsehoods about 2020 election and Pennsylvania vote counts
Promoted widely debunked conspiracies about election fraud en.wikipedia.org.
Posting AI‑generated images of Taylor Swift endorsing him
Shared fake endorsements created with AI en.wikipedia.org+3en.wikipedia.org+3en.wikipedia.org+3.
🔍 Summary
These 20 statements range from geopolitical fantasies (annexation of other countries, militarily acquiring the Panama Canal) to constitutional disregard and mass misinformation. None are grounded in legal or practical reality—many contradicted basic international sovereignty norms, constitutional limitations, or verifiable facts.
Almost all are un-American.